Adding data to CEEDS Tool
The CEEDS Tool uses a tile-server that stores dataset as tile-sets. These are in the mbtiles format. So any data that needs to be imported must be converted to this format.
Converting Datasets to compatible tile-sets
Using QGIS to plot the data and ensure it is correct is a sensible starting point, it can either then be exported as a MBtiles format for rasters or as a geojson for input into Mapbox's Tippecanoe tool that will create a feature MBtiles file from the geojson with sensible zoom levels and tile ids needed for feature highlighting.
shpfile
- Open QGIS and create new project
- Set openstreet map as base layer
- import shpfile and check it plots correctly
- export as geojson file (right click layer, export set geojson as format)
Then install Tippecanoe and run the following command to create the MBtiles file.
$ tippecanoe -o output.mbtiles --drop-densest-as-needed --generate-id input.geojson
This will output a MBtiles file that can be placed in the MBtileserver tilesets folder where it will be automatically added to the server upon restart.
raster
- Open QGIS and create new project
- Set openstreet map as base layer
- import raster and check it plots correctly
- export as mbtiles file (processing toolbox, raster tools, generate XYZ tiles (MBTiles))
QGIS will export the map canvas rather than the actual data so it is important to style the raster data in QGIS ready for visualisation. E.g. define colour maps and classes etc. The export dialog box has numerous options but these can all be left as their defaults aside from setting the zoom layers and the location of the output file, (by default it doesn't write an output file). Determining what zoom layers to use is important, a good explanation of these layers can be found here . It will depend on the resolution of the data but assuming regional scale data, zoom levels 0 to 13 are a good default. This will cover global scale upto village/suburb scale with pixels of around 20 m. If the data has a higher resolution then higher zoom levels can be used but this will increase the output size dramtically and also increase the processing time in QGIS. Finally if a legend is desired, it can be created in QGIS and saved as an jpg and uploaded to the server. See adding legend section.
Creating a legend
If a raster has been converted to a mbtiles format it can be used within CEEDS, to make a legend display when this layer is enabled then the following steps need to be taken.
- create a suitable legend (using QGIS or similar)
- convert to jpg if needed
- upload to assets folder on CEEDS server
- rename to match layer name exactly
- set legend to true in layer configuration within mapstyles.json
Example legend (GEBCO Bathymetry):
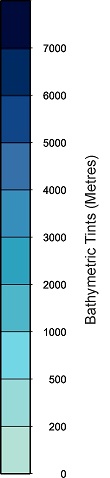
GEBCO Legend example
NOTE: More details are documented in the admin guide section
Add to mbtileserver on CEEDS Tool Server
Save the mbtiles file in the tile-sets folder that is located on the CEEDS Tool server. By default the mbtileserver is located at /home/$USER/go/bin and the tilesets folder will also be located here. The mbtileserver checks this folder for tile-sets on start so it will need to be restarted as follows:
$ sudo systemctl restart mbtile
Check the server restarted properly by running:
$ sudo systemctl status mbtile
This will show is the systemd service is running and the last few lines of the std-out which should show the server starting finding the new tile-sets and running on https://0.0.0.0:8000